Textile exports growth slows down to 5.55% in December
This signals shift in industry toward exporting finished goods rather than raw materials
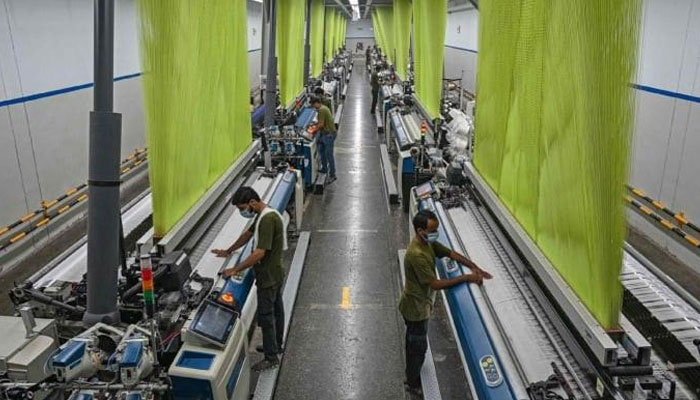
ISLAMABAD: Pakistan’s textile sector, which had experienced double-digit growth for four consecutive months since August 2024, saw a slowdown in December, posting a modest 5.55 per cent increase. Exports for the month totalled $1.477 billion, up from $1.399 billion in December 2023.
The slowdown in growth follows a period of robust performance but still reflects ongoing challenges in the global and domestic market conditions. However, a key aspect of the growth was that all sub-sectors, mainly finished products, saw increases, while exports of unfinished or raw items declined. This signals a shift in the industry toward exporting finished goods rather than raw materials.
In textile sector, ready-made garments were the standout category, witnessing growth of 19.6 per cent to 357.2 million, according to the latest data from the Pakistan Bureau of Statistics (PBS).
In December 2024, cotton cloth exports increased by 3.64 per cent to $148.8 million, knitwear exports up by 6.8 per cent to $391.7 million, bedwear by 13.2 per cent to $256.2 million, and towels by 0.77 per cent to $88.3 million over December 2023.
Exports of unfinished products, primarily raw items, saw a notable decline. Cotton yarn exports dropped significantly by 34.1 per cent, falling to $62.8 million. Raw cotton exports dropped by 95.5 per cent to only $0.6 million against $13.69 million in December 2023. Pakistan’s food exports saw a significant decline in December 2024, dropping 4.23 per cent to $804.8 million from $840.4 million in December 2023.
The most striking aspect of the decline was the sharp drop in rice exports, following the reopening of Indian rice exports. Rice exports fell by 30.6 per cent to $360 million, down from $518.6 million in December 2023. Basmati rice exports plummeted by 40.9 per cent to $47.7 million, while exports of other rice varieties dropped 28.7 per cent to $312 million. Additionally, fruit exports decreased by 15.5 per cent to $36.5 million, and vegetable exports fell by 48.9 per cent totalling $20.64 million.
Among other food categories, fish and fish preparation exports increased by 6.98 per cent to $39.7 million, meat and meat preparation exports increased by 7.4 per cent to $47.3 million, and sugar exports stood at $145.85 million compared to zero sugar exports in the corresponding month of last year.
Exports of sports goods declined by 6.35 per cent to $32.26 million, with football exports contracting by 11.4 per cent to $19.6 million. However, surgical goods and medical instruments exports were up by 6.8 per cent to $39.3 million and cement exports up by 45.5 per cent to $31.9 million. Likewise, chemical and pharmaceutical exports also increased 31.2 per cent to $152.8 million in December 2024 compared to the same month last year, of which pharmaceutical products exports increased by 174 per cent to $63.4 million.
On the import side, Pakistan’s petroleum imports in December 2024 increased by 0.85 per cent to $1.565 billion from $1.55 billion in December 2023. Crude oil imports declined by 5.8 per cent to $526.2 million and LNG import fell by 10.44 per cent to $346.2 million. Imports of petroleum products increased by 9.7 per cent to $584.2 million, and liquefied petroleum gas (LPG) increased by 46.4 per cent to $108.4 million.
Total imports of machinery in December 2024 increased by 28.1 per cent year-on-year to $857.9 million. In this group, textile machinery imports increased by 72.5 per cent to $20.9 million, power generation machinery by 165.7 per cent to $80.25 million, and agriculture machinery by 76.5 per cent to $8.5 million. Likewise, construction and mining machinery imports increased by 127 per cent to $14.65 million, and electrical machinery and apparatus saw an increase of 30.3 per cent to $292.3 million.
Telecom machinery imports, however, declined by 6.2 per cent to $202.7 million, with mobile phone imports declined by 7.3 per cent to $163.2 million.
Transport sector’s total imports in December 2024 increased by 5.2 per cent to $191 million. In this group, spending on road motor vehicles (built units, CKD/SKD) stood at $183.4 million, 6.9 per cent more than the previous year. Imports of completely built units (CBU) for buses, trucks, and other heavy vehicles increased by 13.6 per cent to $31.76 million, with motor car imports falling by 14.9 per cent to $17.4 million. CKD/SKD imports for buses, trucks, and other heavy vehicles also increased by 1.98 per cent to $115 million, and motor car imports declined by 22.6 per cent to $76.2 million. Motorcycle imports increased by 40.8 per cent to $3.88 million, while parts and accessories imports increased by 13.7 per cent to $32.4 million.


-
 'Buffy' Star Nicholas Brendon's Death Case Takes Massive Turn
 -
 FKA Twigs Takes Legal Stand Against Ex Shia LaBeouf
 -
 ‘Progressive’ Kate Middleton Snubs Outdated Royal Etiquette
 -
 Kylie Kelce Explains Why She Avoids Raising Kids With 'silver Spoon'
 -
 Meghan Markle Is Above Royal Family ‘empty Threats,’ Says Insider
 -
 Anne Hathaway Opens Up About 'defeated' Feeling As Working Mom
 -
 Shamed Andrew Should Testify In Epstein Case As ‘act Of Service’
 -
 What Really Happened Before Nicholas Brendon Was Found Dead At Home?
 -
 Sarah Ferguson Branded ‘most Famous Missing Person’ In UK Right Now
 -
 Why King Charles Does Not Need A Driving License? Expert Reveals
 -
 Did Graham Norton Really Sign NDAs For Taylor Swift’s Wedding?
 -
 ‘Polite’ King Charles Treats Staff Better Than ‘boorish’ Andrew
 -
 Princess Beatrice's Husband Raises Eyebrows With Deleted Instagram Post
 -
 Dua Lipa 'snubs' Priyanka Chopra
 -
 Will Taylor Frankie Paul Still Get Her 'Bachelorette' Salary?
 -
 'Harry Potter' Returns: First Glimpse Of HBO's New Series