Economic reforms: Part - XXVII
A key objective of the Poverty Reduction Strategy Paper (PRSP) was to reduce poverty, as measured by income or through other proxies of welfare. Even though, for the greater part of the country’s history, a high degree of income inequality has been a serious concern, the availability of data and measurement was not an issue. Unfortunately, since 2001, the subject of poverty measurement and the publication of its numbers became victim to political considerations.
For a long time, poverty was measured by a simple determination of the share of the population (headcount) having an income of $1 per day (or less), considered sufficient to purchase a basket of calories that are necessary for survival. This is the so-called poverty line. Subsequently, a proper basket was constructed and expenditures on the basket became the basis for poverty measurement. The Household Income and Expenditure Survey (HIES), and later a more broad-based survey on the quality of life was developed – the Pakistan Social and Living Standards Measurement Survey (PSLM). This allowed the definition of poverty to be broadened by measuring it through peoples’ access to basic-needs.
The growth outlook during the 1990s was depressing as an average growth of only four percent was recorded, as compared with six percent or more in the previous decade. The incidence of poverty was stable, averaging around 25 percent, with a hike to 31 percent in 1998-99. Then from 1999 to 2001, the country was hit by a drought, resulting in a significant decline in growth, impacting the lowest segments the hardest.
It was in this background that the poverty numbers of 2000-2001, which showed an increase of up to 35 percent, were considered embarrassing by economic managers and were, hence, not suitable for publication. Incidentally, it happened at a time when work on the PRSP was underway. The discussion on poverty in the paper was missing the impact that the drought had during the two years, when, in fact, those numbers were available. The matter was deferred until the publication of the results of the PSLM, which was undertaken for the first time.
The next opportunity in this regard came in 2009 when the PRSP-II was prepared. But now, a new regime was in office. Two survey results, the PSLM 2004-05 and PSLM 2005-06, were available for use to design a poverty-reduction strategy. Curiously, the document cited the views of the planning commission (PC) that the use of these poverty estimates would undermine the extent of poverty. The commission was of the view that no reliable data existed to estimate poverty in recent years.
Significant changes in the growth pattern and an increase in food and fuel prices had occurred since 2005, adversely affecting the poor. It was said that the planning commission will undertake a comprehensive calculation to estimate poverty trends over the next three years – after it has received the PSLM data for fiscal year 2007-08, likely to be available by May-June 2009. Strangely, the document then cited yet another ‘informal judgment’ from the panel of economists, set up by the PC, who claimed that the incidence of poverty had risen by six percent since 2004-05. Evidently, no data and analysis were provided for this claim.
Notwithstanding this difference of opinion, the surveys showed that poverty had fallen over the two survey periods, from the high of 35 percent in 2000-2001 to 24 percent and 22 percent. Since then, additional data was made available for both 2007-2008 and 2010-2011, which saw an even further decline in poverty – 17 and 14 percent. These numbers were again not owned by the government as much of it was happening under a military regime.
Finally, in 2015, the then government owned up the numbers alongside the broader estimates of poverty based on the basic-needs approach. As per this approach, poverty has declined from 63 percent to 32 percent. In yet another work of the PC, under the aegis of the UNDP, a multi-dimensional poverty index has been constructed based on a large number of social indicators of education, health, family planning, access to electricity, household amenities, assets, livestock, land, etc. Although the extent varies, this has also shown a decline in the trend of poverty.
To address the apprehensions about poverty numbers, in 2012, Pakistan invited Professor Nanak Kakwani, a leading expert in poverty research and head of the UN-sponsored Poverty Research Centre. He verified all the figures. The World Bank was also called in to validate the official estimates, which it did. In fact, the World Bank has partnered poverty reduction work in Pakistan since the 1990s.
It is useful to point out some basic features of poverty in Pakistan. Rural poverty is consistently higher than urban poverty and, among the provinces, Balochistan remains the most affected. It has also been noted that there is a considerable concentration of households around the poverty line, implying that an adverse shock – such as drought, crop failures or large price hike – could push them into poverty. The vulnerability around the poverty line is quite severe, as numbers could rise dramatically with adverse shocks.
Poverty is also associated with lack of access to education and health. Families with an aged bread-earner may face ruination in case the bread-winner falls sick or gets involved in litigation. Direct income transfers such as under the Benazir Income Support Programme have been helpful in reducing poverty. Pakistan has also done well in shared prosperity – an indicator of inclusive growth – compared to its neighbours.
Despite all qualifications made on poverty numbers, and notwithstanding the government’s own complicity in giving rise to suspicions about these numbers, there is hardly a doubt that in the last two decades poverty has considerably reduced. More significantly, a middle class that has fairly robust spending habits, giving rise to high economic growth as is evident today, has emerged. The trouble perhaps remains with income inequality, as the more recent period of poverty reduction is not associated with improvements in inequality measures, such as the Gini coefficient. The recent numbers have not fully accounted for the impact of income transfer programme such as BISP, which, as discussed in Part-XXV, has transferred significant income to the poorest population.
Having said that, there is no room for complacency as inequality remains high and a number of social indicators, such as enrolments, access to clean drinking water, health facilities, the infant mortality rate and access to family planning methods, are far from satisfactory. In the days ahead, we will see considerable deterioration in economic conditions at the macroeconomic level, which will inevitably affect the poor more. The PRSP expenditures need further growth in real terms, as seen since these numbers started being tracked.
The writer is a former finance secretary.
Email: waqarmkn@gmail.com


-
 All You Need To Know Guide To Rosacea
 -
 Princess Diana's Brother 'handed Over' Althorp House To Marion And Her Family
 -
 Trump Mobile T1 Phone Resurfaces With New Specs, Higher Price
 -
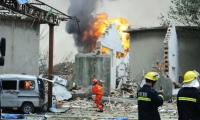 Factory Explosion In North China Leaves Eight Dead
 -
 Blac Chyna Opens Up About Her Kids: ‘Disturb Their Inner Child'
 -
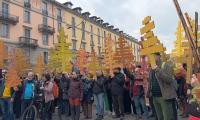 Winter Olympics 2026: Milan Protestors Rally Against The Games As Environmentally, Economically ‘unsustainable’
 -
 How Long Is The Super Bowl? Average Game Time And Halftime Show Explained
 -
 Natasha Bure Makes Stunning Confession About Her Marriage To Bradley Steven Perry
 -
 ChatGPT Caricature Prompts Are Going Viral. Here’s List You Must Try
 -
 James Pearce Jr. Arrested In Florida After Alleged Domestic Dispute, Falcons Respond
 -
 Cavaliers Vs Kings: James Harden Shines Late In Cleveland Debut Win
 -
 2026 Winter Olympics Snowboarding: Su Yiming Wins Bronze And Completes Medal Set
 -
 Trump Hosts Honduran President Nasry Asfura At Mar-a-Lago To Discuss Trade, Security
 -
 Cuba-Canada Travel Advisory Raises Concerns As Visitor Numbers Decline
 -
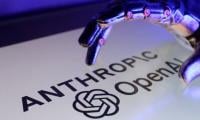 Anthropic Buys 'Super Bowl' Ads To Slam OpenAI’s ChatGPT Ad Strategy
 -
 Prevent Cancer With These Simple Lifestyle Changes