The net profits of listed companies in the Asia ex-Japan region have risen 33-fold since 1999, trouncing gains in the rest of the world, where they have merely tripled in nominal terms.

The net profits of listed companies in the Asia ex-Japan region have risen 33-fold since 1999, trouncing gains in the rest of the world, where they have merely tripled in nominal terms.
Asia’s earnings surge has been led by mainland China, where the net profits of listed companies in the MSCI All Countries World Index were around $303bn in 2017, a 362-fold increase from the $834m generated in 1999, according to figures from JPMorgan Asset Management, accounting for about half of Asia’s rise.
The earnings of public companies have also jumped sharply in South Korea, Hong Kong, India and Taiwan, helping the Asia ex-Japan region raise its share of global profits generated by the 2,400 companies in the MSCI ACWI index from 3.1 per cent in 1999, or $18.2bn, to 25.9 per cent ($623bn) last year.
“Asia’s relevance to the investable world has been transformed in less than a generation,” says Luke Richdale, chief client portfolio manager, emerging markets at JPMorgan Asset Management.
Clearly, a number of caveats apply. The figures do not mean the typical Asian company has increased its profitability 33-fold since 1999, as the data are heavily influenced by the torrent of initial public offerings witnessed in Asia this millennium, which has substantially increased the stock of listed companies.
Stripping out the ever-shrinking equity market of Pakistan, and also Sri Lanka, which is no longer in the MSCI Asia index, Geoff Dennis, head of global emerging market equity strategy at UBS, calculates that the number of emerging Asian companies in the index has risen from 384 to 567 since 1999, with those in China quadrupling from 37 to 152.
“With respect to China we are comparing elephants to mice,” he says.
The starting point, 1999, also represented a cyclical low for Asia, given that the continent was still emerging from its financial crises of 1997-98.
“1999 was directly after the Asian and Russian crises so it was a dreadful year for earnings,” says JP Smith, a partner at Ecstrat, an investment consultancy.
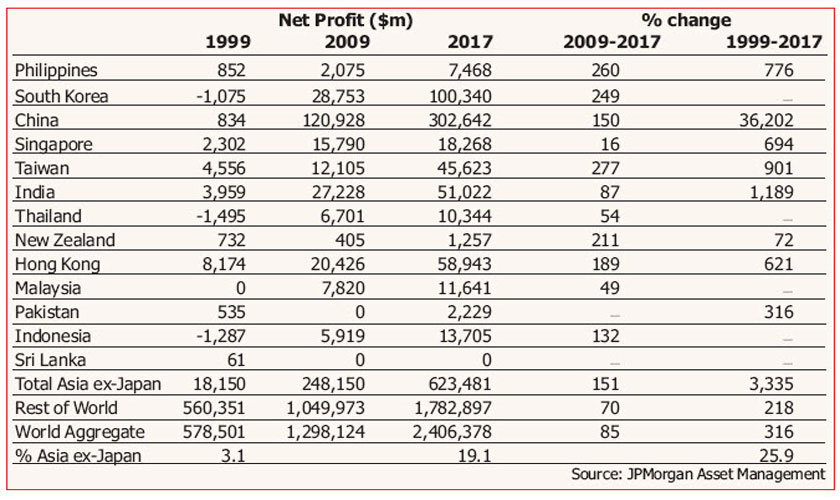
This is reflected in the fact that listed companies in South Korea, Thailand and Indonesia were, in aggregate, lossmaking in 1999, as the table shows, while there was no contribution from Malaysia because the country had been temporarily banished from the MSCI index for introducing exchange controls.
MSCI All Countries World Index: Net profits and percentage change in net profits
“1999 was a very bad year as companies were floundering in the aftermath of the Asian Crisis, not to mention the rarely mentioned China Triangular Debt disaster,” says Gary Greenberg, head of global emerging markets at Hermes, rendering the year a “flattering” starting point.
Mr Richdale accepts these points, noting that of the 10 largest companies currently in the MSCI Asia index only three: Samsung Electronics, TSMC and Hon Hai Precision Industry, better known as Foxconn, were in the index in 1999.
However, he argues that the trend towards emerging Asia accounting for an ever-larger slice of corporate earnings has continued in recent years and is far from over.
Since 2009, for example, a year in which emerging Asian companies were generally in better health than their financial crisis-hit developed world peers, net income has risen 2.5-fold in emerging Asia but by only 69 per cent in the rest of the world.
“What [the data] highlight is just how the region has changed and the further changes that are coming down the pipeline,” says Mr Richdale, with global investor interest in Shanghai and Shenzhen-listed Chinese companies likely to rise still further when these mainland companies start to be included in the flagship MSCI Emerging Market equity index in June this year.
Mr Greenberg is unconvinced about how much the data tell us, given that the likes of Alibaba, the Chinese internet powerhouse, were not listed in 1999 or even 2009.
But “having said that”, he adds, “a few days in Shanghai would confirm the Asian miracle. No doubt there has been an explosion of value creation over the past 20 years.”
Mr Dennis agrees that, despite the caveats, corporate profits are “considerably higher” in emerging Asia now than in previous years, and that this is important.
“Given the way that so many investors benchmark themselves against the indices, it’s a very valid point that 26 per cent of the global profits available through the indices is in Asia ex-Japan,” he says.
Mr Dennis even offers his own “genuine, apples to apples, comparison” to support the argument that companies in Asia ex-Japan are “punching above their weight in terms of profits”: noting that they account for just 12.2 per cent of the market capitalisation of the MSCI ACWI index, less than half of their 25.9 per cent share of earnings.
Nevertheless, investors who foresaw the rise of, say, corporate China, and went overweight the country back in the 1990s have not been rewarded for the prescience, Mr Dennis notes.
“What’s amazing is that China was less than 1 per cent of MSCI Emerging Markets [in 1996] and now it’s 29.7 per cent, but you have barely made any money in China in that period. China has underperformed MSCI EM,” he says, delivering a return of just 58 per cent of the average emerging market over the past 21 years.
Net Profit ($m) % change
1999 2009 2017 2009-2017 1999-2017
Philippines 852 2,075 7,468 260 776
South Korea -1,075 28,753 100,340 249 —
China 834 120,928 302,642 150 36,202
Singapore 2,302 15,790 18,268 16 694
Taiwan 4,556 12,105 45,623 277 901
India 3,959 27,228 51,022 87 1,189
Thailand -1,495 6,701 10,344 54 —
New Zealand 732 405 1,257 211 72
Hong Kong 8,174 20,426 58,943 189 621
Malaysia 0 7,820 11,641 49 —
Pakistan 535 0 2,229 — 316
Indonesia -1,287 5,919 13,705 132 —
Sri Lanka 61 0 0 — —
Total Asia ex-Japan 18,150 248,150 623,481 151 3,335
Rest of World 560,351 1,049,973 1,782,897 70 218
World Aggregate 578,501 1,298,124 2,406,378 85 316
% Asia ex-Japan 3.1 19.1 25.9
Source: JPMorgan Asset Management