Textile exports surge 19.2pc in Feb, marking third consecutive month of growth
ISLAMABAD: The textile industry has recorded a robust 19.20 percent increase in exports for February 2024, continuing a positive trend for the third month in a row, official data showed on Friday.
The exports surge to $1.407 billion from $1.18 billion a year earlier underscores a resilient performance despite a slight 0.65 percent dip in the eight-month cumulative exports since July.
Textile exports increased by 3.3 percent year-on-year in December, 10.10 percent year-on-year in January and 19.2 percent year-on-year in February. The exports for the first eight months (July-Feb 2023/24) witnessed a slight decline of 0.65 percent, amounting to a decrease of $73 million, with total exports reaching $11.145 billion. Last year, in the same period, total textile exports were $11.218 billion.
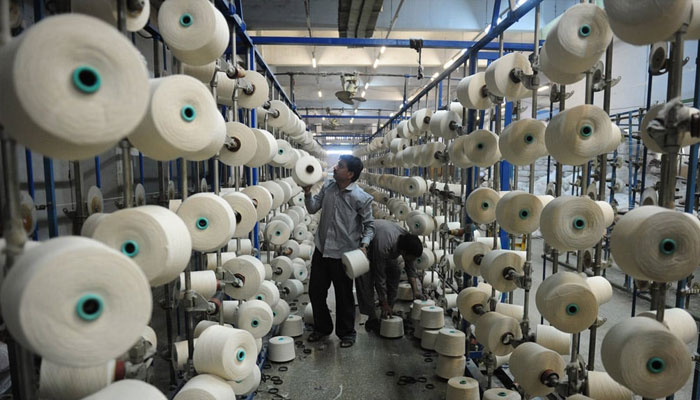
The Pakistan Bureau of Statistics (PBS) revealed that textile group sales were down by 3.31 percent compared with the previous month of January 2024, totaling $1.455 billion. However, during February, sales of major components of the textile group increased by double digits compared to the same month of last year. This includes bedwear, knitwear, towels, readymade garments, cotton cloth, and yarn.
Knitwear exports increased by 21.24 percent to $336 million, bedwear by 24.5 percent to $243.8 million, readymade garments by 20.3 percent to $307 million, and towels by 13 percent to $94.5 million. Similarly, cotton yarn exports increased by 41.2 percent to $78.5 million, and cotton cloth by 12.13 percent to $173.5 million compared to February 2023 exports.
In the food group, rice exports (including Basmati) increased by 48.18 percent to $402 million, driven by increased international demand and high prices due to India's rice export ban in recent months. Basmati rice exports during the month increased by 65.4 percent to $82.5 million, and other varieties’ exports increased by 44.3 percent to $319.6 million.
In the eight months from July to February, rice total exports increased by 85.8 percent to $2.517 billion against $1.355 billion last year, with basmati total exports up 39.4 percent to $539.4 million and other rice sales up 104.4 percent to $1.978 billion.
Vegetable exports increased by 138 percent to $75.4 million, fruits by 49 percent to $35.4 million, and meat and meat preparations by 54.5 percent to $45.5 million. However, fish and fish preparation exports fell by 16 percent to $32.2 million, and tobacco was down by 50.6 percent to $4.13 million over the same month of last year.
Additionally, football exports in February increased by 23.8 percent to $20.25 million, plastic materials by 102 percent to $40.64 million, and engineering goods by 71 percent to $33.5 million, while footwear exports fell by 5.55 percent to $15.22 million.
Pharmaceutical products’ exports were up by 7.1 percent to $29.6 million, cement exports also fell 22.3 percent to $13.25 million, and surgical goods exports went down 13.7 percent to $29.8 million over February 2023. Whereas, leather manufacturing exports were up by 6.7 percent to $41.6 million.
IMPORTS
According to the PBS, the total imports in the petroleum group reduced by 1.5 percent to $1.246 billion in February 2024 compared to the same month of the previous year.
In this category, imports of petroleum products increased by 6.2 percent to $491.2 million, and imports of LPG rose by 4.26 percent to $63.4 million. However, crude oil imports declined by 2.5 percent to $373.5 million, and LNG imports dropped by 11.3 percent to $317.8 million compared to February 2023.
From July to February of FY24, total imports in the petroleum group decreased by 10.9 percent to $10.58 billion compared to $11.877 billion in the same period of FY23. Notably, imports of petroleum products were reduced by 23.2 percent to $4.11 billion, while crude oil imports decreased by 3.8 percent to $3.35 billion. However, LNG imports increased by 2.55 percent to $2.62 billion, and LPG imports also saw a rise of 1.8 percent to $498.4 million.
In February 2024, machinery imports surged by 64.4 percent to $690 million. Within this category, imports of agriculture machinery increased by 44.6 percent to $4.4 million, electrical machinery and apparatus by 109.4 percent to $268.6 million, and textile machinery imports by 23 percent to $14.7 million. Similarly, telecom machinery and other apparatus witnessed a substantial increase of 210 percent to $191.5 million, largely due to a surge in mobile set imports.
Notably, Pakistani imports of mobile sets amounted to $161 million in February 2024, marking a 410 percent increase from February of the previous year, where imports totaled $33.1 million. In the eight months from July to February of FY24, the import of mobile sets accounted for $1.15 billion, reflecting a significant increase of 156 percent compared to the previous year's imports of Rs 448 million.
Imports of construction and mining machinery fell by 14.5 percent to $7.6 million, and power generation machinery imports decreased by 40.4 percent to $22.8 million. In the transport sector, total imports in February 2024 declined by 1.84 percent to $134.34 million compared to $136.86 million in February 2023. However, imports of completely built units (CBU) of buses, trucks, and other heavy vehicles saw a substantial increase of 237 percent to $28 million. Imports of motor car units increased significantly by 572.6 percent to $26.2 million compared to the same month last year.
Imports of completely knocked down (CKD)/semi-knocked down (SKD) models of cars, motorcycles, buses, trucks, and other heavy vehicles decreased by 24.9 percent to $67.3 million in February 2024. Within this category, motorcar imports fell by 26.6 percent to $51.2 million, while motorcycle imports increased by 81.7 percent to $3.65 million. Parts and accessories imports were also down by 16 percent to $19 million.


-
 Kate Middleton Knew Should Could Not Be ‘voice Of Reason’ With Prince Harry
 -
 Rihanna Has Wardrobe Malfunction At A$AP Rocky Fashion Show
 -
 Prince Harry Felt System Had ‘one Rule For Him, One For Prince William’
 -
 Jake Paul's Fiancée Sends Him Over The Moon Over Stunning Victory
 -
 Why Prince William, Kate Middleton 'partnership' Is Important For Monarchy
 -
 Katie Price Drama Escalates As Family Stays In Touch With Ex JJ Slater
 -
 Critics Target Palace Narrative After Andrew's Controversy Refuses To Die
 -
 Sarah Ferguson’s Delusions Take A Turn For The Worse: ‘She’s Been Deserted’
 -
 ICE Agents 'fake Car Trouble' To Arrest Minnesota Man, Family Says
 -
 Camila Mendes Reveals How She Prepared For Her Role In 'Idiotka'
 -
 China Confirms Visa-free Travel For UK, Canada Nationals
 -
 Inside Sarah Ferguson, Andrew Windsor's Emotional Collapse After Epstein Fallout
 -
 Bad Bunny's Star Power Explodes Tourism Searches For His Hometown
 -
 Jennifer Aniston Gives Peek Into Love Life With Cryptic Snap Of Jim Curtis
 -
 Prince Harry Turns Diana Into Content: ‘It Would Have Appalled Her To Be Repackaged For Profit’
 -
 Prince William's Love For His Three Children Revealed During Family Crisis