Print Story
X

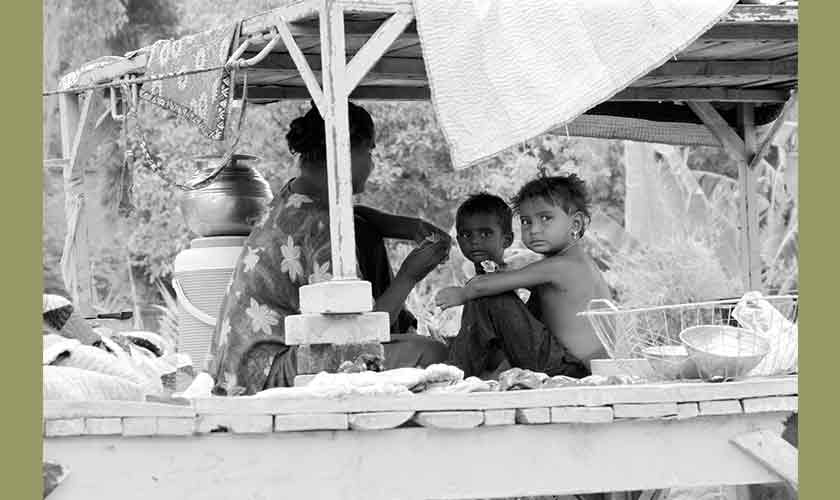
If not addressed properly and in a timely manner, the social, political and economic repercussions of income inequalities may be disastrous
Economic inequality is a topical issue, demanding attention from Sub Saharan Africa to the establishment in the developed world. This goes well beyond the inequitable distribution of opportunities amongst various strata of the economy. It is a leading indicator for lack of opportunities. This then continues from generation to generation in an endless vicious cycle. It leaves a vast swathe of the population bereft of the ability to maintain a reasonable lifestyle and without access to necessities such as healthcare and education.
There are two ways to look at inequality within an economy: inequality of income distribution and inequality of wealth distribution.
Of the two, income inequality is the more popular, better understood and more easily researched. An income can come from two sources: labour and capital (i.e. returns from capital). In the latter, inequality of wealth comes into play, impacting the total income generation capacity of an individual.
The most popular measure of income inequality is the Gini coefficient (named after Corradi Gini, an Italian economist). Gini index ranges between 0 (perfectly equal distribution of income across the economy) and 100 (most imperfect distribution of income, i.e. one person has all the income in an economy).
This index has been tracked for decades and has been a useful guide to identifying interesting patterns. Countries with common geopolitical backgrounds tend to be in the same range.
Based on the World Bank’s estimates, former Soviet states have the lowest Gini coefficients (in the high teens). This is followed closely by the Scandinavians who are recognised for their egalitarian economic models (in low 20s). On the other hand, African nations such as South Africa, Namibia and Botswana are on the highest end of the scale (high 40s).
In terms of Gini, Pakistan performs reasonably well compared to its regional peers — 30.7 vs India (35.1), Sri Lanka (39.8), Nepal (32.8) and Bangladesh (32.4). Gini data is useful as it allows us to group nations together to understand what common factors drive the income distribution trends.
As an extension to Gini, the analysis of income share of top earners in a country reveals a similar pattern, as an additional validation.
Income inequality varies vastly between regions — Europe being most egalitarian (where top 10 percent earners took 37 percent of the economic income) vs the Middle East the least (10 percent have access to 61 percent of the regions’ income generation). These numbers are also impacted by regional geopolitics. We see a spurt in income inequality in Russia (as oligarchy came to prominence in the 1990s), China (following the economic boom from 2004) and India, where rising inequality is at a level where the top 10 percent earn more than 50 percent of the entire economy.
This phenomenon is not limited to the Third World only. Research by Mckinsey Global Institute (MGI) (published in 2016) identified patterns which have led to income disparity in the developed world. Analysing data for world’s top 25 countries post World War II, the study revealed that during the post-recession recovery (1993-2005), 98 percent of the households saw some increase in their incomes. However, during the post-recession recovery period of 2005-2014, 65-70 percent of the households in these economies saw their income either fall or stay flat. Clearly, the fruits of any economic growth were captured by a few.
There is a price to pay for this. In the USA, only 20-30 percent of children end up going to college if their parents are bottom 10 percent earners. Top 10 percent earners, however, see 90 percent of the children going to college.
The impact of this economic imbalance is not going unnoticed. In the same study MGI found a sense of hopelessness and frustration leading to a hardening of attitudes on race, immigration and free trade.
The other and more esoteric measure for economic inequality is wealth inequality. Recent research, Thomas Piketty being a notable example, seems to suggest that this measure is a starker indicator of economic disparity.
Wealth (or capital, used interchangeably here) measures the accumulation of resources, by an individual or a category of individuals, which can generate income streams for its owner. This can be in the form of land/property or financial investments (shares, bonds etc). This wealth or capital can be inherited by the next generation and brings with it benefits which may seem insurmountable to achieve to those without access to it. In addition to giving a basic sense of security (in the event of a health or other crisis), wealth brings a potential income/earnings stream that can take years or decades for ones without capital to replicate.
Piketty asserts (backed by compelling statistics) that over the last few decades the rate of return on capital has exceeded the rate of the growth of real income over the same period. As a result, the accumulation of capital has accelerated leading to further disparity between those with and those without access to capital.
Based on the above, as capital generates higher returns, it boosts income more disproportionately in favour of the holders of capital/wealth, thereby exacerbating the polarisation. Data has shown that the scale of wealth inequality surpasses that of income inequality.
This thesis has now been picked on by others. Paul Krugman has vociferously backed Piketty’s research. For nearly a decade, investment bank Credit Suisse’s research institute has been publishing an annual Global Wealth Report. In 2017, Oxfam, the charity, used the Credit Suisse’s data sets (amongst others) to highlight some alarming statistics on wealth inequality across the globe. Just eight richest men own the same amount of wealth as the bottom 50 percent of the world population. Extending this study further just 1 percent of the richest people control more wealth than the balance 99 percent.
The gap between regions is also startling. In 2017, the average wealth per adult in Africa was US$4,166 vs US$374,869 in North America (US$135,163 in Europe). It is little wonder that there is no let-up in throngs seeking migration to economies offering astronomically higher economic wealth (and income).
Europe and North America have 17 percent of the world’s adult population yet they control more than 64 percent of global household wealth. The inequality between societies is a topic often overlooked in this debate.
A person needs only US$3,582 to be amongst the top 50 percent of the world’s wealthiest. US$76,754 will get you into the top 10 percent club and US$770,386 into the ultra-exclusive top 1 percent. Top 10 percent of the world own approximately 88 percent of the world’s wealth.
This is clearly not sustainable.
Inequality is a fact, and a natural phenomenon, but its quantum can be managed. This is subjective and, at the same time, a highly sensitive conundrum which can potentially impact millions in a society: how much inequality can we tolerate? If not addressed properly and in a timely manner, the social, political and economic repercussions could be disastrous.
The writer is a chartered accountant with several years of banking experience in Europe and the Middle East