Print Story
X

Images obtained through satellite technology identify perennial issues related to spatial growth of Punjab cities, providing reliable data for the first time

Punjab is the most developed and populous province of the country, second only to Balochistan in terms of its geographical area. Over the years, its cities have undergone spatial growth and seen their populations increase at a high rate.
In many cases, there has been little planning, and things have happened haphazardly. The cities of the province have continued to grow, mostly horizontally, with a marked difference in population densities in different parts. This implies that some parts of the cities have developed more and others less, and also that there are major inequalities among different segments of people inhabiting these areas.
The unbridled, horizontal growth has also eaten up the agricultural lands that lay on the outskirts of the cities when these had not expanded so much. As this spatial growth is not aligned with the economic growth and social development of these geographical areas, many issues have emerged that need to be addressed.
The Punjab government confesses that the development in the province "is under tremendous pressure from uncontrolled urban sprawl, deteriorating environment, deficiencies in basic services, shortages in the provision of housing, and absence of properly developed areas for economic activity, industrial estates, technology parks, and related infrastructure."
In order to address these perennial issues, the government has launched different initiatives like building of a computerised land records system, especially in urban areas, to improve the functioning of land markets; reforms to increase density such as creating a framework for multiple ownership premises, amending building control regulations, and promoting mixed land use.
The focus of the government has also shifted to conducting regional planning centred around cities, and strengthening civic agencies to provide equitable and improved infrastructure and services to these cities.
Though these would look good on paper, the situation on ground was that there was little data available to the planners regarding the growth pattern of Punjab cities and their population. The population figures they relied on were estimated as no census had been done after 1998. This had made evidence-based planning difficult for the government. When you do not know how much your cities have grown and what populations they have to cater, you cannot plan properly.
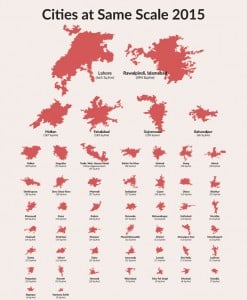
Against this backdrop, there is an interesting development regarding collection of data about cities’ spatial and population growth. The Urban Unit has come out with ‘Punjab Cities Growth Atlas 1995 to 2015’ that provides a unique perspective to the cities. It is an attempt to spatially demarcate the urban extent of 194 cities (in 36 districts) of Punjab in contrast with the administrative boundaries of the local government system, says Memoona Arsalan, spokesperson of The Urban Unit.
The data about the urban extent and population of these cities has been measured with the help of US-based satellite technology.
According to Arsalan, mostly the population size is used to identify urban areas and to assess the level of urbanisation but this Atlas presents another dimension to measure urbanization: the increase in the area of urban extent of cities.
She points out that as per the contents of the Atlas, the cumulative urban area of Punjab’s cities has expanded three times over a period of 20 years -- i.e., from 1995 to 2015. The expansion are found to have predominantly occurred at the cost of dwindling population densities, which means that less people are occupying more land in newly developed areas.
The innovative and applied use of satellite and remote sensing technologies, computer alogarithm, and knowledge of urban planning have contributed to this work, says Arsalan. "This will be a good reference for government departments, civic agencies, urban planners, researchers, students, and so on. It will also provide guidance to policy makers, practitioners and citizens to move towards sustainable urbanisation with optimum urban densities."
Sana Riaz, member, Urban Planning Team at The Urban Unit, claims that satellite imagery has shown that certain cities have grown beyond their municipal limits whereas others haven’t. According to the methodology applied for this purpose, the boundaries have been drawn where there is a break of one kilometre or more, and this growth is not contiguous. The empty areas demarcated for housing societies, cantonments etc are however included in the geographical limits of the cities.
Population estimates were also based on satellite technology, house survey results etc because the 2017 population census results were not available at the time.
On the utility of this exercise, she says, the Atlas produced after a year’s hard work identifies gaps in urban planning and points out which areas of the cities are overdeveloped and overpopulated and which ones under developed and under populated. "This identification is important because low-density growth in areas away from city centres creates the need for development of high-cost infrastructure such as roads, sanitation facilities, electricity transmission lines, gas pipelines etc. With the help of the Atlas, the provincial and local government authorities can identify the problem areas."
The Atlas is divided into four sections. The first section provides an overview of all the 194 cities in Punjab. A visual representation of the location of cities and detail including city names, respective districts and areas has been provided here. Section 2 focuses on connectography which is the visualisation of complex transport networks settlements. In Section 3, there are classifications, rankings, and statistics for 50 cities of Punjab in terms of urban extent, area, expansion, urban population, population growth rates, land consumption, densities and economic regions. The fourth section provides this information in visual, graphic and tabular formats.
For each city, a unique map for urban extent in the years 1995, 2005, and 2015 represents the magnitude of urban expansion over a period of two decades, and another set of maps presents the evolution of intra-cities as the city expands.
Gohar Majeed, a Lahore-based real estate developer, appreciates the exercise but adds it is very difficult to change the preferences of people. "People want to own land, and that is why we see urban sprawl rather than vertical growth in the form of high-rise residential buildings.
"Many housing societies on the outskirts of cities still lack natural gas and sanitation facilities because the cost of providing these is quite high and the number of beneficiaries is far low than in city centres or areas close to city centres," he adds. "The people must change their priorities and understand that vertical and high-density urban growth is the need of the time."